We’re happy to announce the release of Logaholic 6.0.9. This version features lots of improvements and some powerful new features.
New insights in browsers and operating systems by country
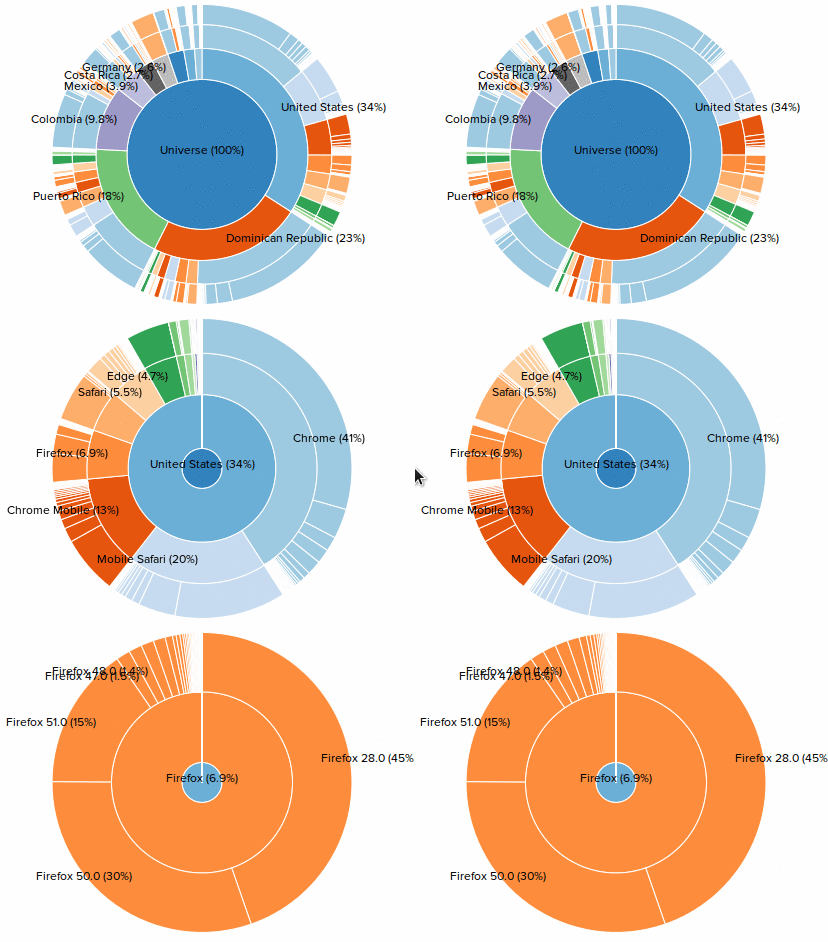
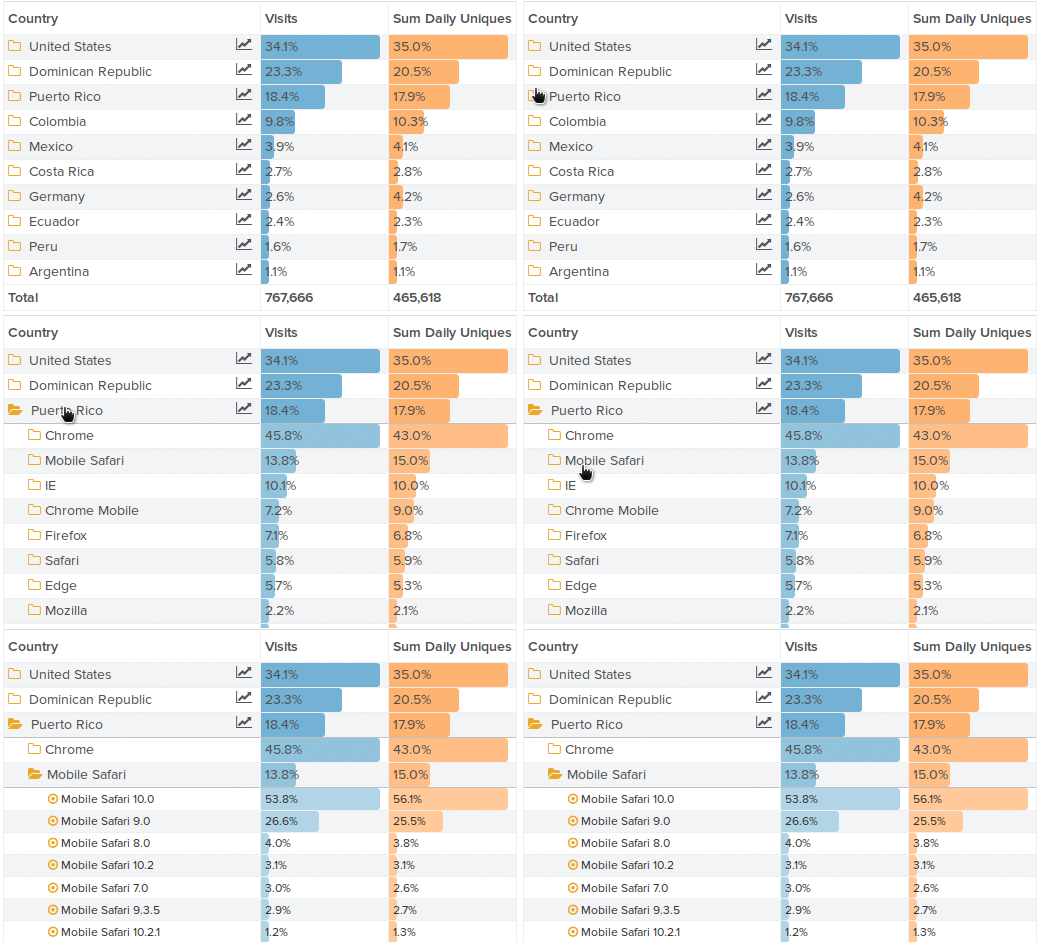
The new Logaholic reports called Browsers by Country and OS by Country provide a powerful breakdown of browser and OS preferences in two great new visualizations:
Sunburst Visualization:

Drilldown Visualization:

Social Media break down and Trends
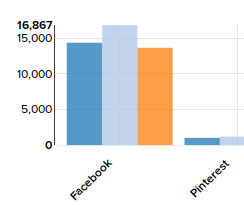
This report breaks down your analytics by social media platform, find out how many visitors you are getting from all major sites, like Facebook, Linkedin, Youtube, Instagram and many more, including international platforms like Weibo and vKontakte.

Desktop or Mobile?
Mobile internet usage is going though the roof, but that impacts some sites and web apps much more than others. So it’s time to know: How much of your traffic is mobile?

More trends
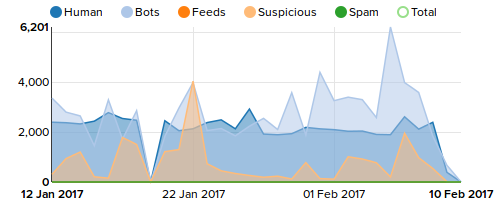
A new Visitors per Year report lets you easily compare your traffic from year to year. The OS Trends report give you a high level view of changing OS usage. The All Traffic by Type report gives a birds eye view of how Logaholic has classified your traffic.

Power features for serious analysts
We’ve added some features that might not be at the top of the list for everyday users, but our power users have told us they need it – so we built it!
Private Dashboards:
If you are sharing profiles and dashboards with your clients, it’s sometimes nice to have a private dashboard that only you can see.
Global and Private Segments:
Logaholic’s segmentation filters are great for slicing and dicing your data into cohorts that are more valuable when analyzed separately. If you have a lot of profiles, you can now make global segments that are instantly available in all your profiles. Or, you can make the segment private, so only you can see it.
Custom cookie tracking and user identification:
Imagine being able to identify your visitors by email or username across all your web analytics reports. Custom cookie tracking now makes it possible to use any cookie your site or web app might use to identify a visitor and pass that to logaholic as the main visitor ID.
Dashboard layout options:
It now possible to change the number of columns in your dashboard – from 2 up to 6 columns (some people must have really big screens)!
Improvements
This version also has improved translations – so you can enjoy your stats in German just as much as in English.
Data export options like CSV and JSON have been improved and enabled on more reports. Your data – use it however you want.
On screen tutorials have been improved to get you up and running with Logaholic in no time.
Logaholic 6.0.9 is now available on our Saas platform or as download.
 admin, February 10, 2017