In web analytics, conversion rate is the percentage of users who take a desired action. These actions can include signing up for a service, downloading a file, subscribing to a newsletter, making a sale etc..
The conversion rate is one of the most useful website metrics in the web analytics toolkit because it’s a great way to measure the quality of your website traffic, your website content and your offer.
It is also a great basis for ad spending. Simply put, if you know it takes 100 visitors to make a $20 sale, you know you can’t pay more than 20 cents per visitor before you start to loose money.
However, often the conversion rate is calculated over all your traffic, in which case the results can be misleading.
If your site gets a total of 500 visitors a day and 10 visitors converted, your conversion rate is 10/500*100 = 2%. Simple right?
The problem with that is that not all traffic is created equal.

Different visitors have different motives and circumstances under which they visit your site. Some may have no interest in your offer to begin with, some may have landed on your site for whatever reason, without any intent to ever convert… they just don’t fit.
It might be nice to have them on your site, but these aren’t the people you are looking for when you set up Adwords ads or a Facebook campaign, or when you try to optimize a page’s conversion rate.
What we really want to know is: who are our customers? What does that traffic look like and how can we get more of that.
From our example above, let’s say all our paying customers come from the US, but over half of our website visitors come from other countries. In this case, it’s much more interesting to consider these separate groups when calculating our conversion rate.
In web analytics, segmentation refers to looking at parts of your data, rather than everything in total.

Knowing our customers come from certain countries is a great way to divide our visitors into more meaningful buckets, or “segments”.
In our example, even though our overall conversion rate may be just 2%, for the audience we actually care about the REAL conversion rate is double that, 4%.
That also means we can spend twice as much on advertising per visitor, provided we target the ads to the same type of visitor segment.
So, how do we find our customer segments?
This is where your web analytics tool comes in. You’ll need a tool that allows you to segment your traffic and run reports on just that group of visitors.
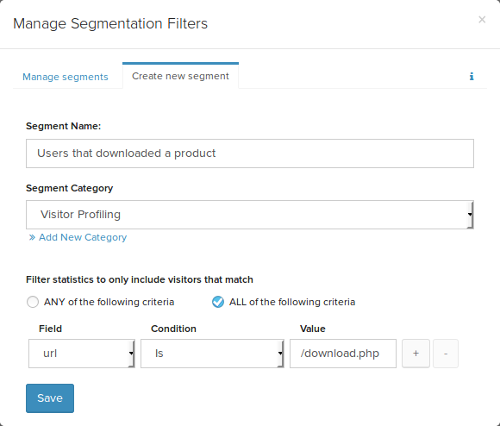
In Logaholic, you would create a segment based on one of your target actions, for example:

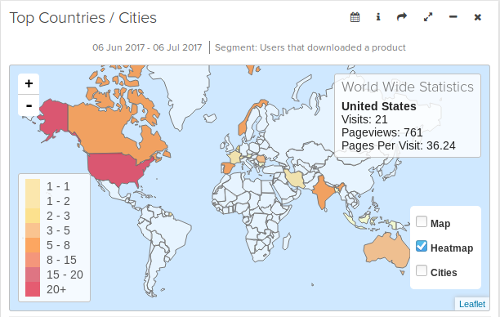
Then you can run that segment of reports like Top Countries, Top Referrers, Top keywords and so on to find out where these converted visitors are from and how they got to your web site.

Using this information, you can create new segments that define your customers groups more closely. For example from US with referrer Google or Facebook kittens group…. whatever works for your traffic.
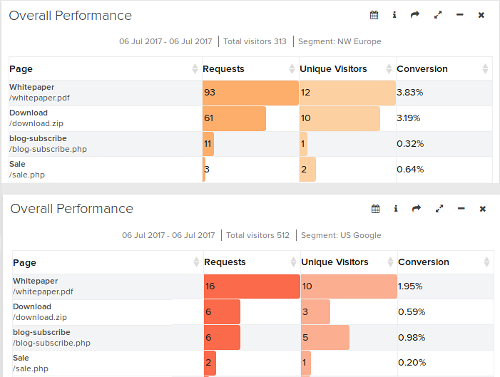
Once you’ve done that, its time to check your conversion rates again.

You now have multiple conversion rates for multiple desired actions across multiple visitor segments. This gives you a much better picture of what kind of visitor you are after and what they are worth.
Real conversion rate
Armed with this information, you’ll be able to target your ads in systems like Google Adwords, Facebook and others more accurately. That should also help bring your cost per visitor down.
Looking at your conversion rate through the lens of a segment will also allow you to spot differences in preferences between your segments. You can use this to tailor content on your website to certain groups, to increase your conversion rate even more.
Never miss an update. Sign up to receive an email whenever we post something in the blog.
 admin, July 7, 2017